How We Interpret the Data
Our Sophisticated Analysis Model
You might notice that some of the figures in the above chart, particularly around how long a CSO has been overflowing, are different from the figures on other websites. We use a more sophisticated model to figure out when CSOs really started overflowing.
The water companies send a signal each time a CSO overflows, saying that it has 'Started' and telling us when. Sometimes though, it sends multiple 'Started' events in a row. One event will say 'Started at 1pm', the next 'Started at 3pm', the next 'Started at 10pm'...
Its clear though that despite the latest alert being 'Started at 10pm', the overflow did actually start at 1pm - so the CSO has been overflowing for far longer. This is how we keep track of the state of each CSO overflow, and why our numbers are different, we don't just rely on the latest information.
There may be errors in our interpretation... and if we find any we're committed to updating this information so that it is as accurate as possible. If you find an error, please let us know.
Why This Matters
Accurate tracking of overflow durations helps us hold water companies accountable and provides a true picture of pollution in our waterways.
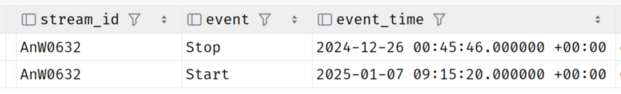
Raw Data from Water Companies
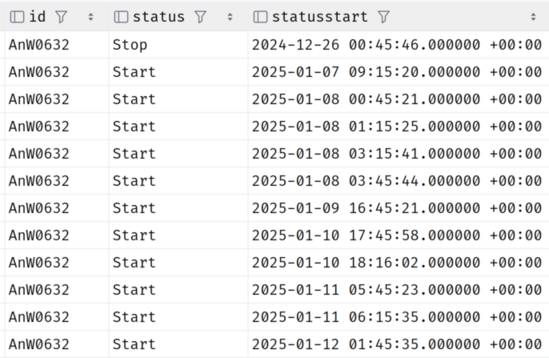
Our Interpretation