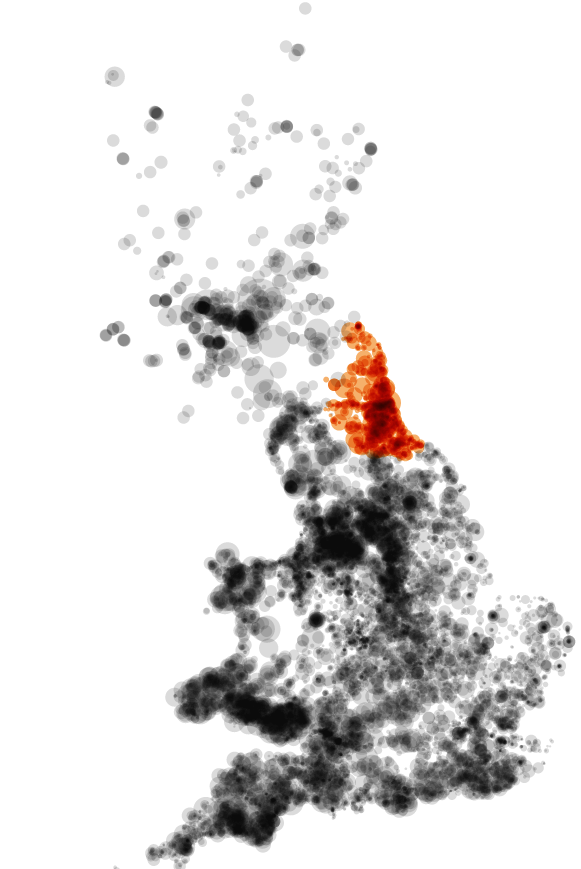
Northumbrian Water

was responsible for at least 46,492 sewage overflows in 2023
On average 127.4 times a day

These lasted for 280,029 hours (That's 32.41 years!) - in 1,382 different locations across their service area

2023 - By Water Company

How does each water company compare? These are the totals by company for each. The totals are really high, counting things in hours doesn't make it very easy to think about. Here we show how many years of continuous sewage dumps happened in a single year, by water company.

2023 - Asset Spill Duration Comparison

It isn't like there are just a few outliers... the problem exists across the entire estate of water assets. Here we show a 'cumulative frequency diagram' - where the number of CSOs that dumped sewage for a time, or longer, is shown. You can see that many CSOs dumped sewage into a river for months and months.

Northumbrian Water is highlighted in the plot below

2023 - Worst Locations Northumbrian Water

1. HOWDON STW

North Tyneside polluted for 5,288 hours, into River Tyne Saline Estuary

453 incidents

That's 7.34 months.

On average 1.2 times a day

2. COTHERSTONE SEWAGE TREATMENT WORKS

Bishop Auckland polluted for 3,674 hours, into River Balder

223 incidents

That's 5.1 months.

4.3 times a week, on average

3. EPPLEBY SEWAGE DISPOSAL WORKS

Richmond (Yorks) polluted for 2,888 hours, into Forcett Beck

209 incidents

That's 4.01 months.

4 times a week, on average

4. BELLINGHAM STW

Hexham polluted for 2,822 hours, into River North Tyne

203 incidents

That's 3.92 months.

3.9 times a week, on average

5. NORTH BLYTH PUMPING STATION

Wansbeck polluted for 2,740 hours, into Blyth Saline Estuary

148 incidents

That's 3.81 months.

2.8 times a week, on average

6. LOW WADSWORTH STW

North West Durham polluted for 2,562 hours, into Wear

147 incidents

That's 3.56 months.

2.8 times a week, on average

Water Companies

Data Sources & Accuracy

EDM (Event Duration Monitoring) data and Consented Discharges to Controlled Waters with Conditions from Environment Agency & Data Map Wales, and Scottish Water

Experimental derived data from Thames Water API, Some data may be missing or inaccurate. This uses Environment Agency rainfall data from the real-time data API (Beta) - Rainfall data is delayed by up to two days.

This website is intended to provide an accurate representation of the Environment Agency data. The data is hard to use, and thus some errors may have been made. If you find something that is incorrect, please raise an issue at the GitHub issues page and we'll endeavour to fix it quickly.

This project is not associated, approved or endorsed by any of the companies whose logos you see here.